Covid-19 Pandemic
Summary
Coronavirus disease 2019 (COVID-19) is a contagious disease caused by the coronavirus SARS-CoV-2. The disease quickly spread worldwide, resulting in the COVID-19 pandemic.
Without pandemic containment measures – such as social distancing, vaccination, and face masks – pathogens can spread exponentially.
This report analyzes the effect of the pandemic globally from the data collected from OurWorldInData.org and consolidate the findings into a dashboard in Tableau.
Outline
As part of the analysis, we will be following the steps mentioned below.
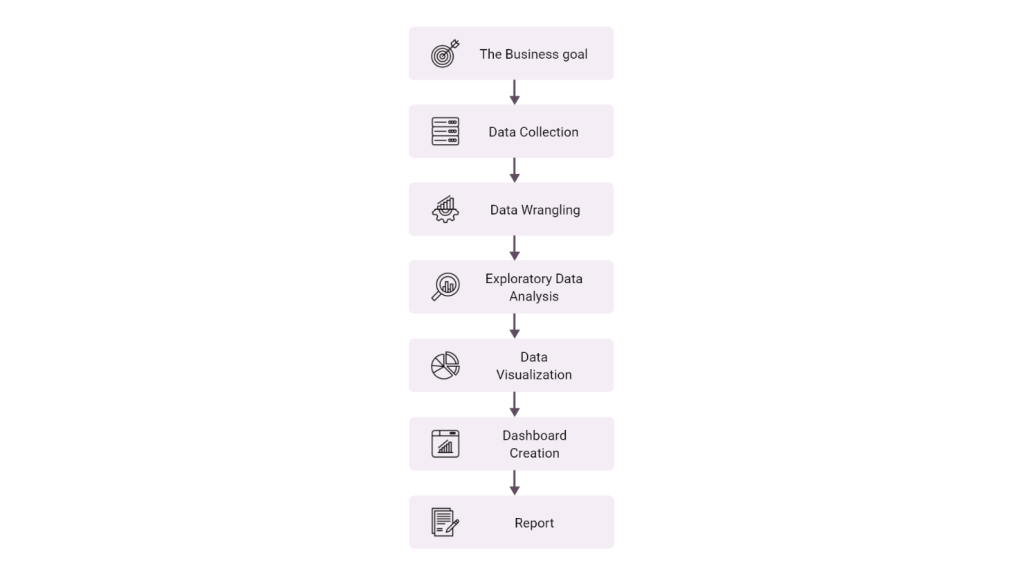
1. Business Goal
Objective of analysing this data set is to identify the effect of the Covid-19 pandemic around the world.
2. Data Collection
The data has been collected as a csv file from OurWorldInData.org under creative commons by license.
The data is uploaded into a PostgreSQL db ‘covidcases’ using the following python code.
i. Import the necessary libraries
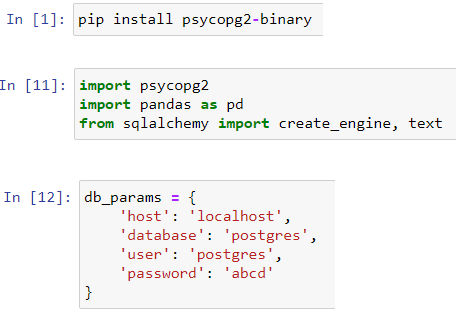
ii. Connect to the db


iii. Upload the file contents to the db

3. Data Wrangling
Here the raw data will be converted into into a more usable form. A series of processes designed to explore, transform, and validate raw datasets from their messy and complex forms into high-quality data will be applied. This data will be used to produce valuable insights and guide business decisions.
As part of data wrangling the steps followed are mentioned below.

i. Data Discovery
a. Overall data information
Db “CovidCases” has to data tables:
- deaths
- vaccinations
- Run the query SELECT * FROM deaths;
- Eyeball the data overall, the columns, types, rows, and values.
- Number of rows = 395834
- Number of columns = 27

ii. Data Transformation
a. Select the columns of interest
Create a new table to hold these columns or delete the unwanted columns.
CREATE TABLE covid_deaths as
SELECT
iso_code, continent, location, date, population, total_cases, new_cases, total_deaths, new_deaths, icu_patients, hosp_patients, weekly_icu_admissions, weekly_hosp_admissions, total_tests
FROM deaths;
Run SELECT * FROM covid_deaths;

b. Delete duplicate rows

We then inspect the value of row_num column to see if any rows have value > 1, if so, it indicates the presence of a duplicate.
In this case no records are returned indicating the absence of duplicates.
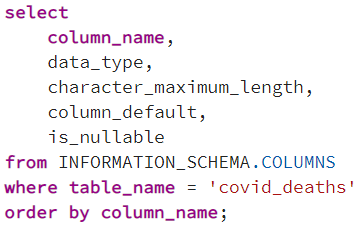
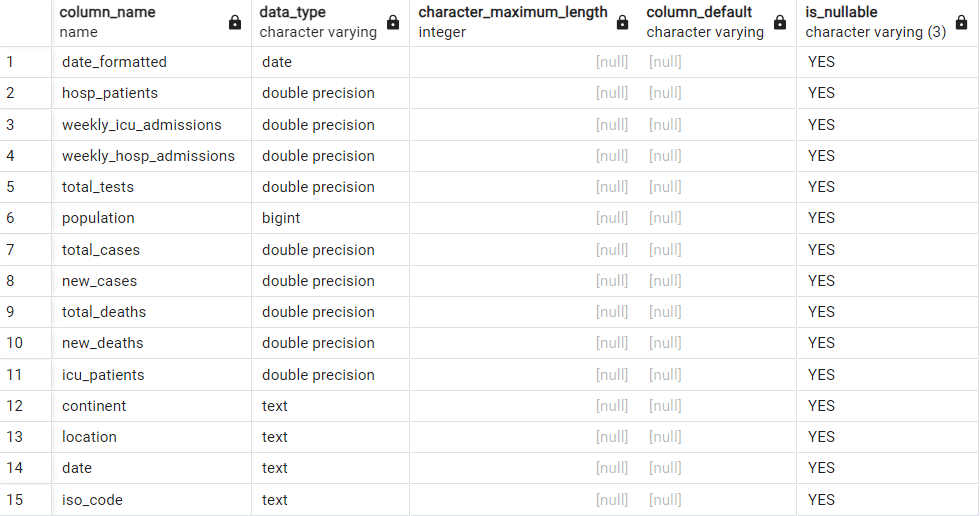
c. Checking for nulls
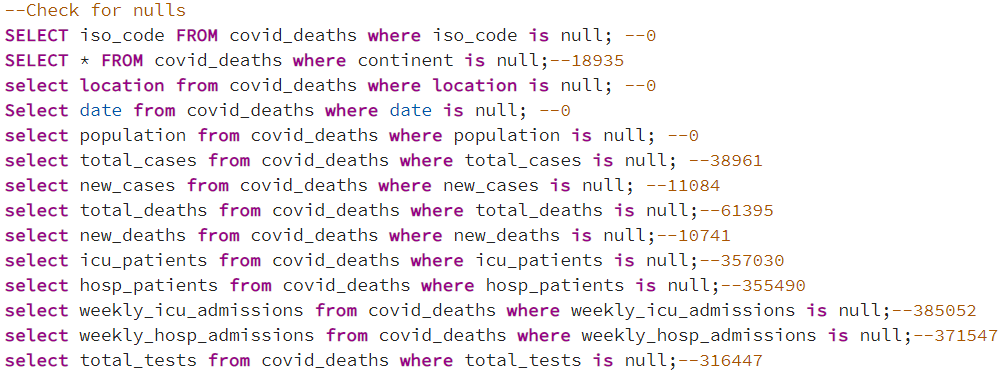
The columns iso_code, location and date do not have nulls and we will be using these as the primary coulmns. The columns containing nulls will be filtered in the queries as data is not provided.
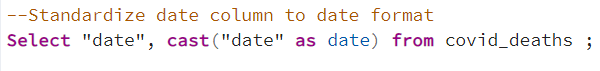
d. Standardize the date column to date format
4. Exploratory Data Analysis
EDA is an analysis approach that identifies general patterns in the data. These patterns include outliers and features of the data that might be unexpected.
As part of EDA the steps followed are mentioned below.

i. Data Distribution
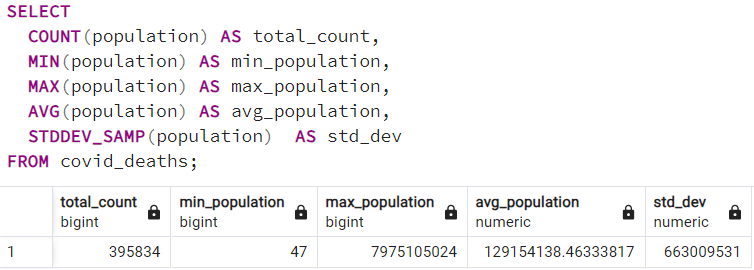
a. Checking for the size of dataset

b. Inspecting the column Continent


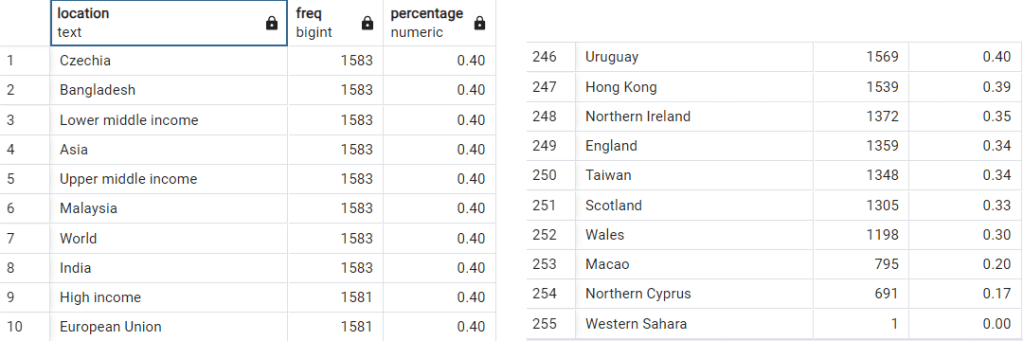
c. Inspecting the column Location
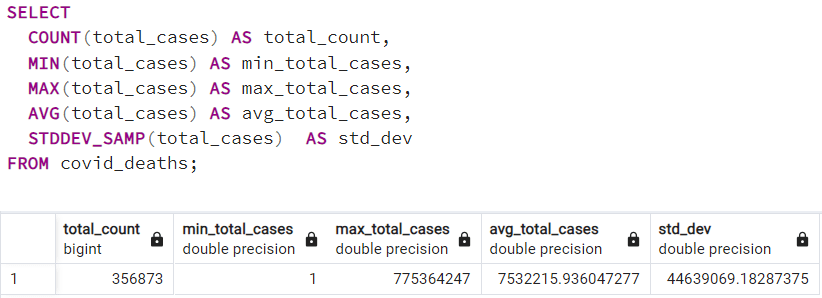
d. Inspecting the column total_cases
e. Inspecting the column total_deaths

f. Inspecting the column Population
g. Inspecting the column Date

ii. Correlation
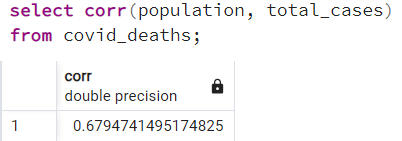
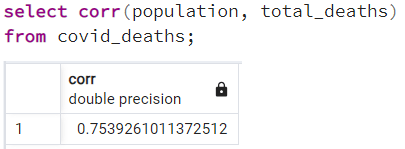
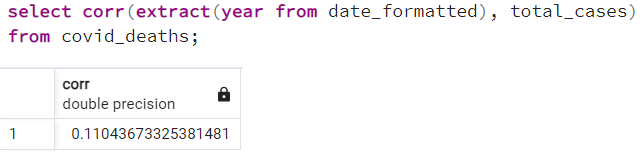
The Pearson correlation measures the strength of the linear relationship between two variables. It has a value between -1 to 1, with a value of -1 meaning a total negative linear correlation, 0 being no correlation, and + 1 meaning a total positive correlation.
a. Correlation between total_cases and total_deaths

b. Correlation between total_cases and population
c. Correlation between total_deaths and population
d. Correlation between year and total_cases
4. Data Visualization – Dashboard

