Candy Crush Saga
Summary
Candy Crush Saga a hit mobile game developed by King and is played by millions around the world. The game is structured as a series of levels and in each level, players need to match candies to clear the level and progress on the level map.
Candy Crush is dependent on its level design to both engage and monetize its player base. The game needs to maintain the delicate balance of difficulty and fun to maximise the time spent in game and in turn lead to conversions at specific choke points of difficult levels.
Outline
As part of the analysis, we will be following the steps mentioned below.
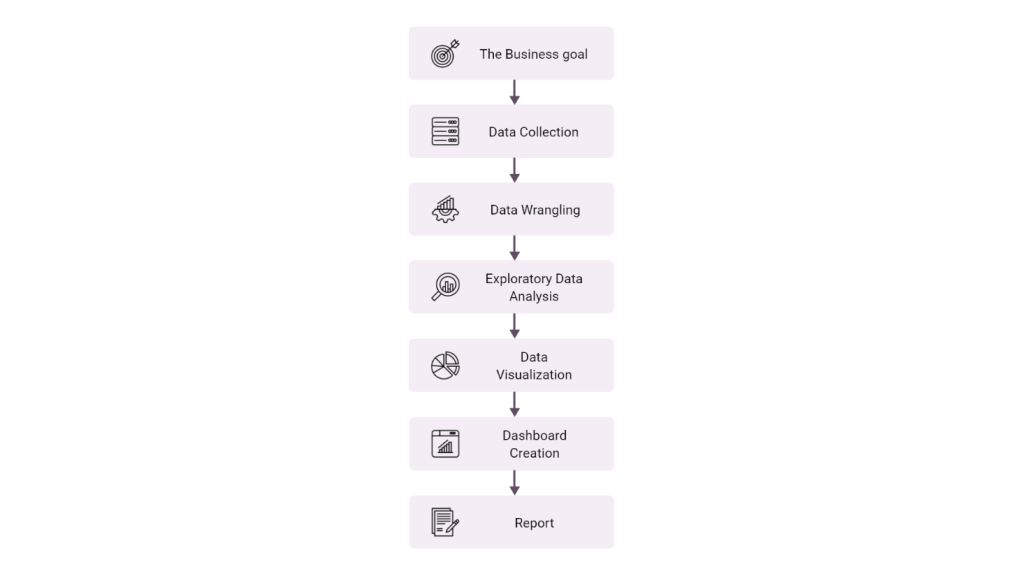
1.Business Goal
The data has been collected as a csv file from Kaggle, a website that allows users to find datasets to work with.
i. Import the necessary libraries

ii. Upload the csv file into a pandas dataframe
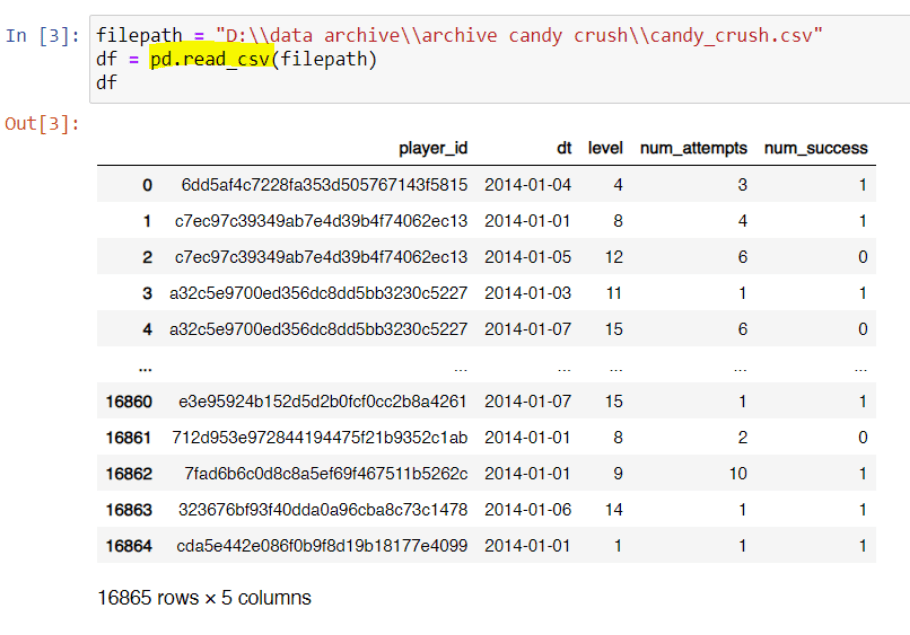
iii. Eyeballing the data, it can be noted that there are 5 columns and 16865 rows.
3. Data Wrangling
Here the raw data will be converted into into a more usable form. A series of processes designed to explore, transform, and validate raw datasets from their messy and complex forms into high-quality data will be applied. This data will be used to produce valuable insights and guide business decisions.
As part of data wrangling the steps followed are mentioned below.
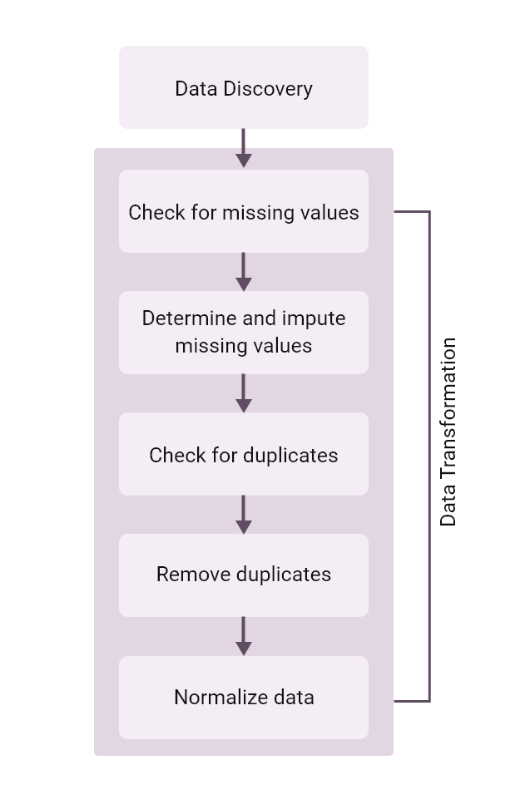
i. Data Discovery
a. Overall data information
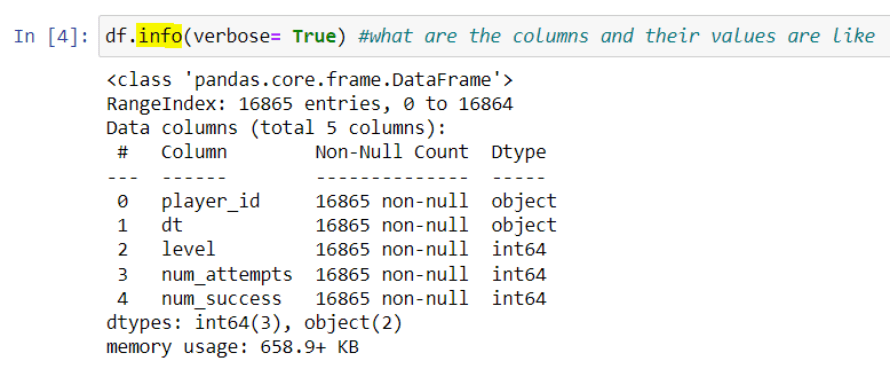
b. Shape of the data

c. Checking the column headers and column values

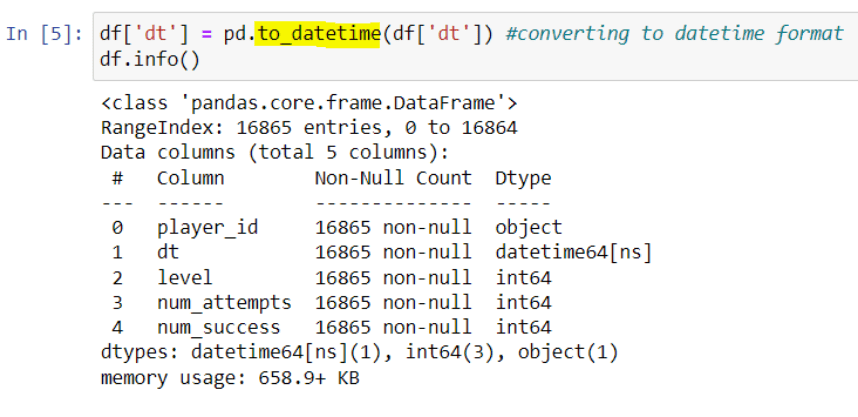
ii. Converting ‘dt’ column to datetime format
iii. Checking for missing values

There are no missing values in this data set, so no need to impute missing values.
iv. Checking for duplicates and dropping them

4. Exploratory Data Analysis
EDA is an analysis approach that identifies general patterns in the data. These patterns include outliers and features of the data that might be unexpected.
As part of EDA the steps followed are mentioned below.

i. Statistical Summary of the data

Here from the max and min of the date column we can deduce that the data given is for a week.
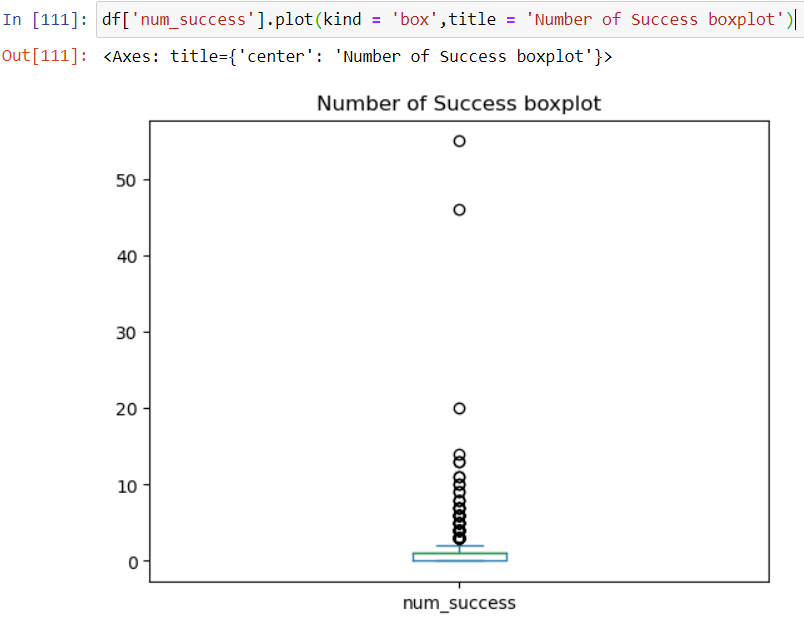
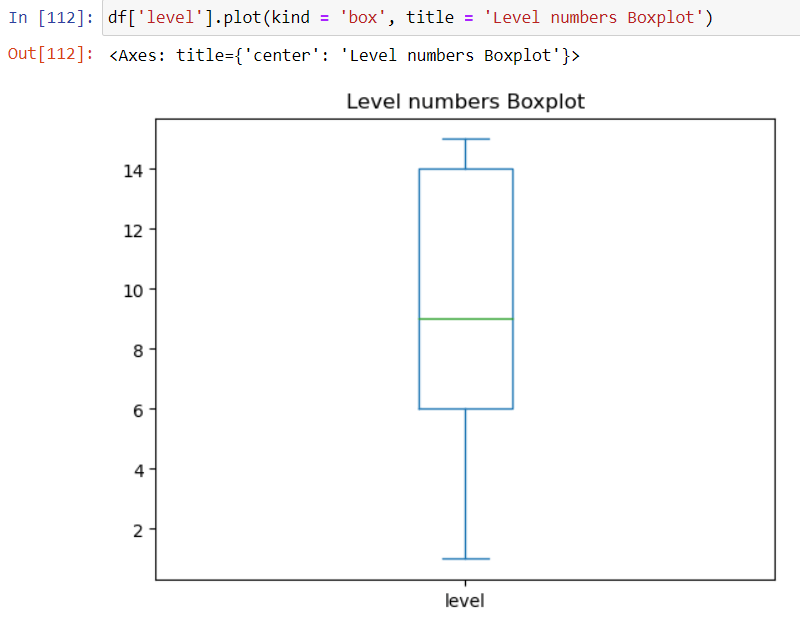
ii. Data distribution and outlier detection
Boxplots are used to observe the distribution of data and detection of outliers that skew the data.

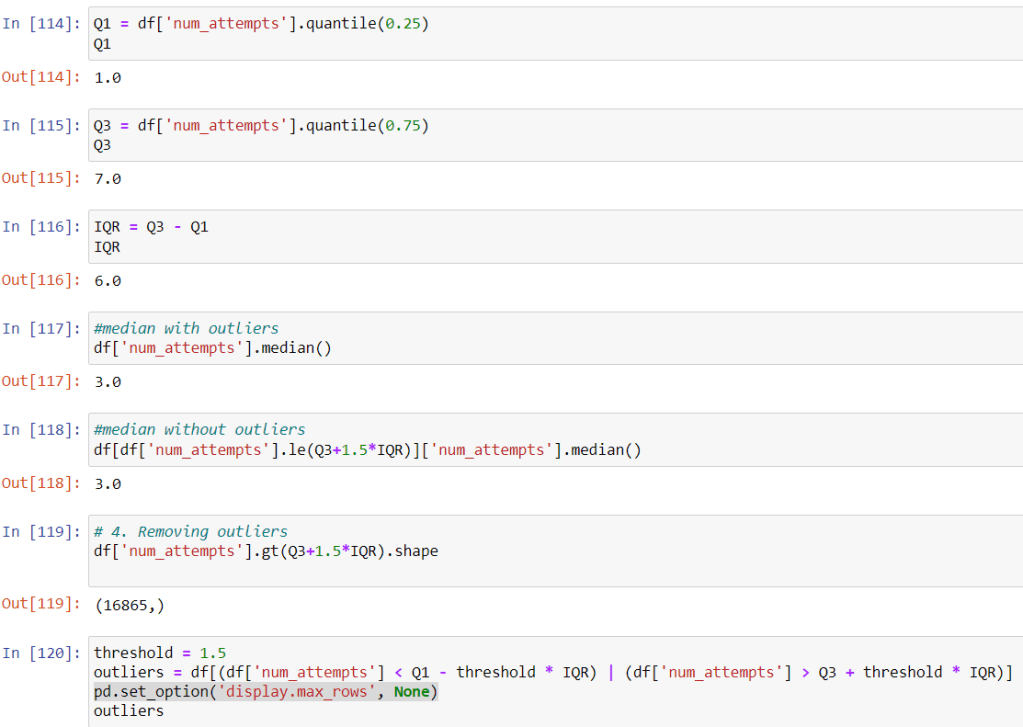
iii. Removal of outliers

Similarly, outliers were removed for number of successes too, and boxplots were charted thereafter to see the data distribution and to confirm the elimination of outliers.

iv. Correlation between data
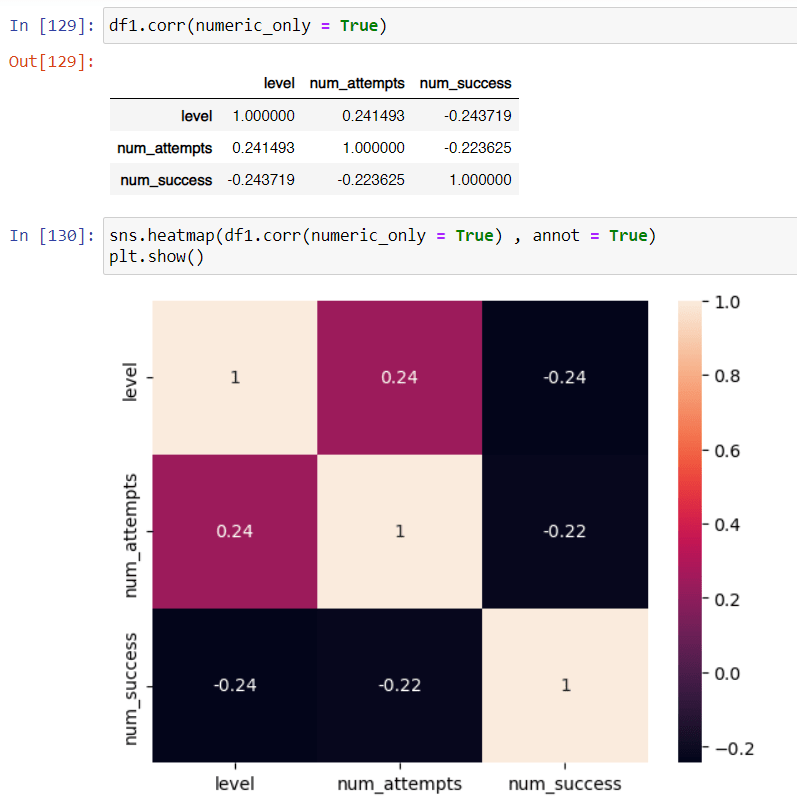
The Pearson correlation measures the strength of the linear relationship between two variables. It has a value between -1 to 1, with a value of -1 meaning a total negative linear correlation, 0 being no correlation, and + 1 meaning a total positive correlation.
There are no positive or negative correlations between the various columns.
5. Data Visualization

There are greater number of players at levels 15, 8 and 5 and least at the initial ones.
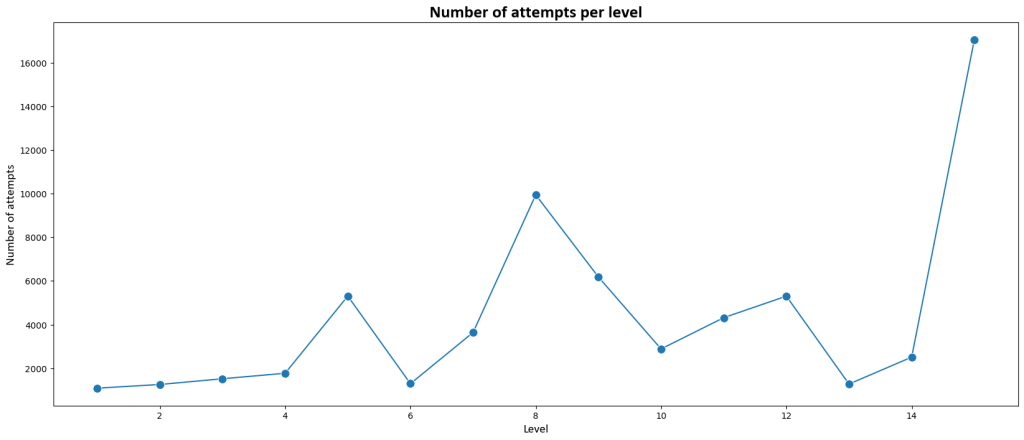
Number of attempts per level is max at 15, 8 and 5. It is least in the initial levels.
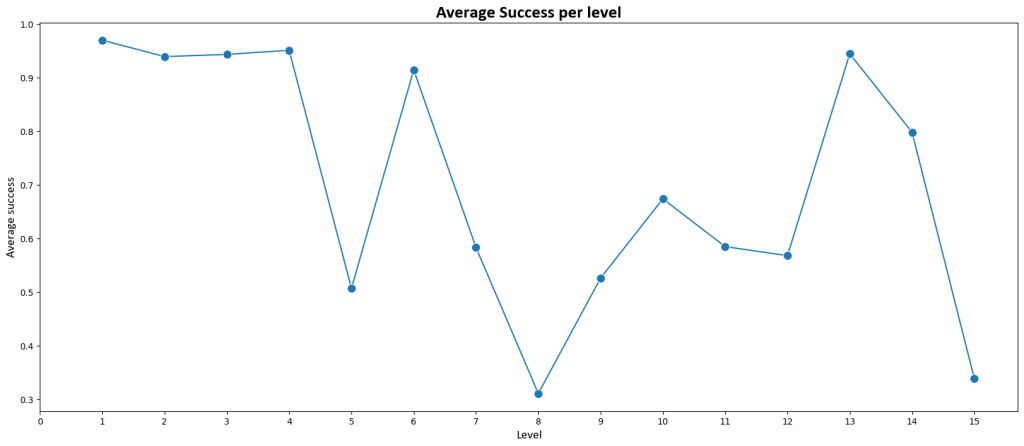
Average success per level is max at the lower levels and drops at 15, 8 and 5.

The rate of winning is higher for lower levels the difficulty increases with the increase in the levels especially for levels, 5, 8, 15.

More number of players have played the lower levels and lesser progress to level 15.

Players are more active over the first two days and the retention drops over day 3.

Most of the playing is done over day 1 and 2.

Over the three days of playing, the player engagement is highest at initial levels and drops with increase in the levels. That is players drop over increasing levels.
6. Dashboard

